System Monitor
System Monitor publishes runtime health metrics for the Banalytics agent: CPU load, memory usage, disk space, thread counters, active users, WebRTC buffers, and media stream activity.
Turn agent health into observable events
System Monitor displays hardware and runtime usage for the local Banalytics server. Use it when operators need a live overview of resource consumption, or when automation rules should react to low disk space, high CPU load, growing memory pressure, or WebRTC buffer saturation.
The monitor periodically collects a system snapshot and publishes it as a System state event. These events can be displayed in the UI, recorded by Event History, or processed by Event Manager rules.
Start with default refresh
Keep Refresh interval (sec) at 5 for normal operation. It gives fresh health data without producing one event per second.
Choose where events go
Forward only the monitor data that is needed for alerts, dashboards, or audits. Very frequent monitor events can make Event Manager rules and Event History noisier.
Tune only for a reason
Lower the interval for active troubleshooting and raise it for long-term audit history or low-resource devices.
Configuration parameters
| Parameter | Required | Description | Default |
|---|---|---|---|
ID | Yes | A unique, fixed identifier for this system component instance. This value is generated by the platform and is not editable. | Auto |
Restart on failure | Yes | Restart mode after an error:
| 10 sec |
Refresh interval (sec) | Yes | Metrics publishing interval in seconds. Lower values make alerts react faster but increase event volume. Higher values reduce event volume and smooth short CPU spikes, but alerts react more slowly. Valid range: 1-60. | 5 |
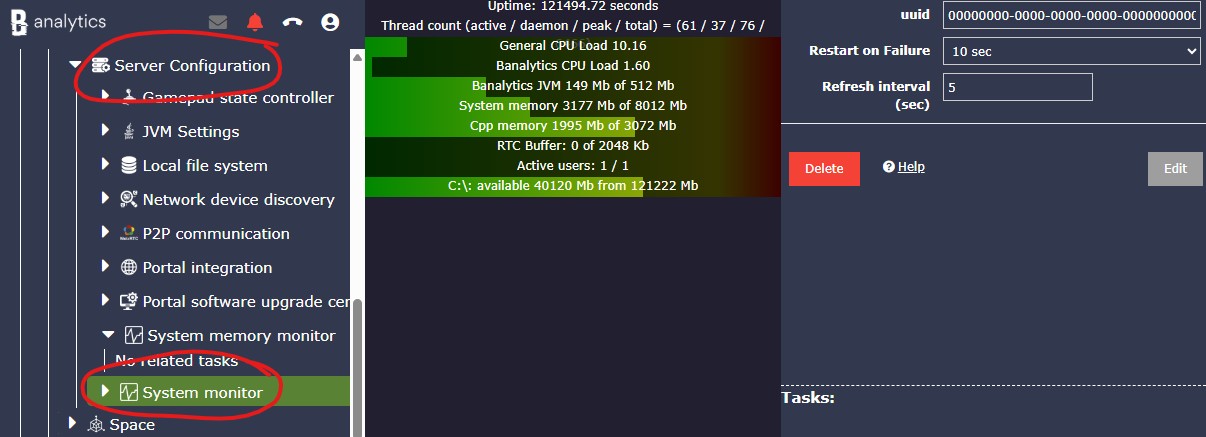
Interpret the monitor snapshot
System Monitor samples CPU every second, accumulates CPU values, and publishes one event every configured refresh interval. CPU values are averages over that interval, while memory, disk, thread, and network counters are current snapshot values at event time.
General runtime
Uptime shows how long the server has been running since the last restart. Thread counters show current, daemon, peak, and total started threads.
CPU load
General CPU load is the host CPU usage. Banalytics general CPU load is the CPU usage of the Banalytics JVM process.
Memory pressure
Banalytics JVM memory tracks Java heap usage. System memory tracks physical RAM, and CPP memory reflects native resources when the native monitor is available.
Disk space
Disk metrics show filesystem roots, total space, usable space, and drive markers. Use them as early warnings before recording or cleanup tasks run out of storage.
Live streaming
Active users, active audio/video streams, and RTC buffer values help diagnose remote preview and file transfer capacity. A constantly growing RTC buffer can indicate insufficient outgoing bandwidth.
System state events
Use the latest state snapshot for UI integrations, and use Event Manager rules when the system should react automatically to resource pressure.
Use monitor events for operations and automation
Metric groups
General health
Track JVM uptime and thread counters: current threads, daemon threads, peak thread count, and total started thread count. This helps detect thread growth, unstable restarts, or unexpected workload changes.
CPU load
Use host CPU load and JVM process CPU load to understand whether pressure comes from Banalytics itself or from other operating-system processes.
RAM and native memory
Watch system free/total memory, JVM heap memory usage, and native/C++ resource data when available. This is especially useful for media, AI, codec, and WebRTC workloads.
Disk retention monitoring
Build rules around usable disk space and file storage cleanup policies. Monitor events are an early warning layer, not the only storage protection mechanism.
WebRTC and live preview diagnostics
Watch outbound traffic, active users, active audio/video streams, and RTC channel buffer usage while tuning remote preview, browser clients, and file transfer.
Recommended profiles
Default operations
Keep Refresh interval (sec) at 5. This gives reasonably fresh health data without producing one event per second.
Fast incident detection
Use 1-2 seconds when you need quick alerts during commissioning, performance testing, or active troubleshooting. Return to a higher value after the incident because the event rate increases.
Stable audit history
Use 10-30 seconds and forward only selected monitor events to Event History. This keeps long-term history smaller and smooths temporary spikes.
Low-resource agent
Use 15-60 seconds and avoid heavy rules on every monitor event. Monitor events include disk roots and WebRTC/media counters, so frequent processing can add unnecessary overhead.
WebRTC diagnostics
Keep the interval at 3-5 seconds and watch active users, active video streams, active audio streams, and RTC channel buffer values while tuning live streaming.
Disk retention monitoring
Use monitor events as early warning for low usable space, then let File Storage cleanup policies and retention rules handle actual data removal or archiving.
Operational notes
Refresh changes restart the monitor
Changing Refresh interval (sec) restarts the component so the new publishing interval can be applied cleanly.
CPU values are averaged
CPU metrics are averaged over the configured refresh interval. Memory, disk, thread, and network values represent the current snapshot at event time.
Keep rules focused
Frequent monitor events can make Event Manager rules and Event History noisy. Route only the metrics that are actually needed for alerts or audits.