
Account & subscription
Banalytics VMS
Components
Privacy and Security
Dashboards
Built-in or USB Camera & Microphone
Network Camera
ONVIF Camera
Telegram Bot
File Storage
Audio Output
Event Manager
IP Address Change Tracker
Tasks
Capture Video with a USB or Built-in Camera
Capture Video with a Network Camera
Capture Video with an ONVIF Camera
Watermark
Motion Detection
Motion Recording
Continuous Recording
AI Object Classification
Actions
System Monitor
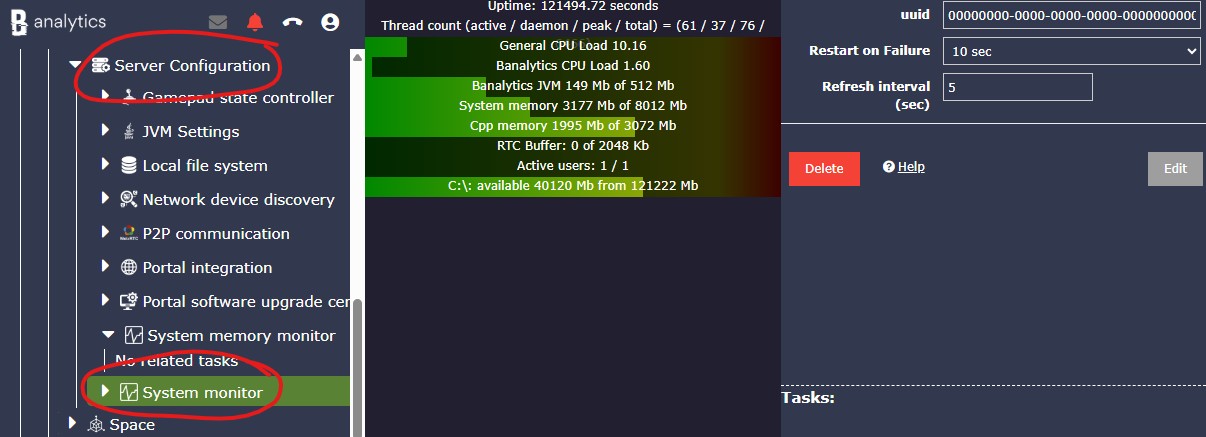
The system monitor displays hardware usage. Here is how you can interpret the parameters.
- Uptime: The duration since the server was last restarted. A higher uptime indicates stable, uninterrupted system operation and continuous surveillance performance.
- Thread count: The total number of tasks currently running or executed since the last server restart.
- General CPU load: The overall processor usage by all running processes on the operating system.
- Banalytics general CPU load: The CPU resources used specifically by the Banalytics application.
- Banalytics JVM memory: The amount of memory currently used by the Java Virtual Machine running Banalytics.
- System memory: The total available physical memory (RAM) on the system.
- CPP memory: The memory consumed by native (C++) system libraries used by Java through native bindings.
- RTC buffer: The memory allocated for real-time communication data packets. Note: If this value continuously increases, it may indicate insufficient network bandwidth, as outgoing data packets are not being transferred quickly enough.
- Active Users: Total users currently active on the system.
- Disk space: The total available physical memory (RAM) on the system.
Configuration options
| Value | Required (Yes/No) | Description | Default |
|---|---|---|---|
| uuid | Yes | A unique, automatically generated identifier for this component instance. This value is not editable. | |
| Restart on failure | Yes | Restart mode upon catching an error:
|
Default to 10 sec |
| Refresh interval(sec) | Yes | Refresh interval in seconds. | Default to 5 sec |